I’ve gone out of my way on several occasions to explain why mortgage rates are not directly affected by Fed rate cuts. Now this week, the Fed cut its rate and mortgage rates dropped abruptly the very next day. Is it time to revisit this logic?
Not even a little bit. It is true that the Fed cut its policy rate this week. And you’ve no doubt heard newscasters refer to that as “a rate that affects a wide variety of consumer loans.” But apart from certain Home Equity Lines of Credit (HELOCS), the Fed Funds Rate has no direct bearing on longer-term mortgage rates.
Why did rates drop right after Fed day then?
First off, if the Fed rate cut were a big deal for the bond market (which underlies mortgage rates), we would have seen a big, immediate reaction in bonds. We didn’t…
Instead, bonds weakened slightly in the 30 minutes following the Fed’s rate cut. It wasn’t until markets got clarity on the Fed’s policy path that things began to improve. And EVEN THEN, the improvement related to Powell’s press conference was dwarfed by that seen the following morning.
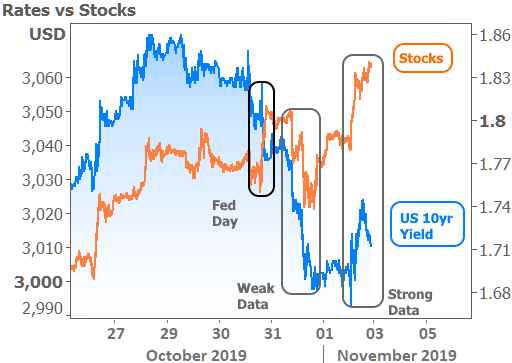
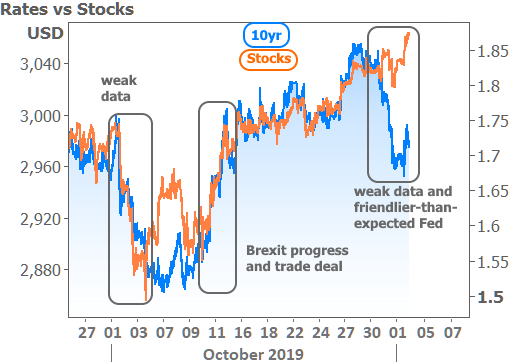
The stock market can actually help us make more sense of the movement in bonds (aka “rates”). Both stocks and bonds like a friendly Fed. With Powell being perceived as friendlier than expected, both stocks and bonds improved (orange line moved higher and blue line moved lower in the following chart on “Fed day”).
Then notice how the orange line (stocks) reverses course and heads lower the next morning in the “weak data” box. This had to do with a report that Chinese officials cast doubt on the viability of the US/China phase 1 trade deal. The move was exacerbated by an exceptionally weak economic report from the Institute for Supply Management-Chicago (Chicago PMI).
The big drops in the orange and blue lines inside the “weak data” box coincide exactly with the trade deal headline and the Chicago PMI data (which is seen as an advance indicator for other key economic reports). Because stocks were falling at the same time, it confirms the source of the movement was the downbeat data and not some after-effect from Fed day.
Stocks and bond yields ended the week by moving higher on Friday. This was partly due to a stronger-than-expected jobs report, but that was actually more of a benefit to stocks. Bonds were fairly undecided until the ISM Manufacturing data was released (one of those important reports for which Chicago PMI is an advance indicator). While the ISM number was indeed weaker than expected, it didn’t miss the mark by nearly as much as the Chicago number. The result was a modest increase in yields.
Despite the weakness on Friday, rates did very well overall this week, and that couldn’t have come at a better time. Just last week we were forced to discuss a fairly gloomy outlook when we asked if it was time to start worrying about rising rates.
In fact on Thursday alone, rates dropped at their fastest single day pace since March 22nd. To be fair, many lenders adjusted rate sheets on Wednesday afternoon, but even if we consider a 48 hour time frame for mortgage rate movement, changes of that magnitude (about an eighth of a percentage point or 0.125%) are rare. In fact, more often than not, entire weeks go by without a 0.125% change in average 30yr fixed rates.
The size and speed of the move is interesting in and of itself, but it’s made more interesting by the fact that this week’s most prevalent mortgage rate headlines claimed that rates were actually HIGHER. Rest assured, that’s not the case. So what’s with the misleading headlines?
This is actually a fairly common occurrence. It stems from the fact that the industry’s longest-standing and most widely-cited mortgage rate barometer–Freddie Mac’s weekly rate survey–is only updated once per week. Moreover, Freddie’s weekly rate is announced on Thursday morning whereas the data is primarily collected on Monday and Tuesday. The last 2 days of the week aren’t even counted.
All of the above means that any significant movement in rates in the 2nd half of any given week can create a big discrepancy between Freddie’s numbers and reality. The differences are only more pronounced if rates were moving in the opposite direction heading into the first part of the week, which is exactly what happened this time around.
In other words, Monday–the day that gets the most weight in Freddie’s survey–saw the highest rates of the current week. They didn’t fall much on Tuesday or Wednesday, which is the last possible opportunity for rate quotes to make it into Freddie’s survey. As such, the survey logically conveyed “higher mortgage rates this week” just in time for lenders’ actual rate sheets to show the huge improvement.
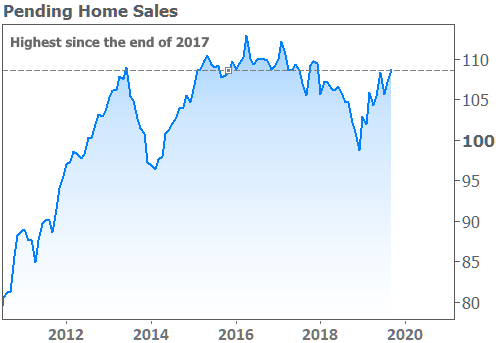
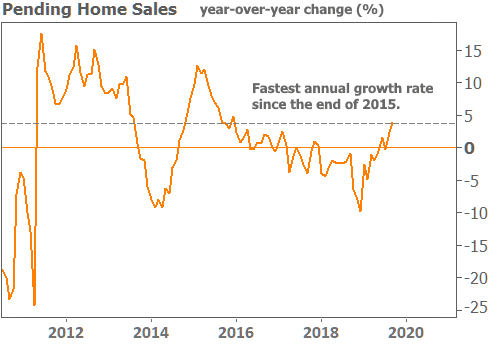
In addition to the welcome developments in rates, a key housing report out this week showed the highest levels of Pending Home Sales since the end of 2017 and the fastest annual growth since 2015.
Surging sales, and big drops in mortgage rates! Are we out of the woods with respect to last week’s doom and gloom? Ah… it would be great if anyone could accurately predict that future, but the market remains beholden to data and events that have yet to occur. Sure, analysts can guess at how things might happen, but the market simply adjusts itself to account for those guesses anyway. The best we can do is understand the future in “ifs” and “thens” based on what markets say is important to them.
If we zoom out the stock/bond chart to a slightly wider time frame, we only get more evidence that economic data and the trade war are hot topics. Events like Brexit and other geopolitical considerations will also flare up and offer some input from time to time, but these are generally supporting actors next to the state of the global economy.
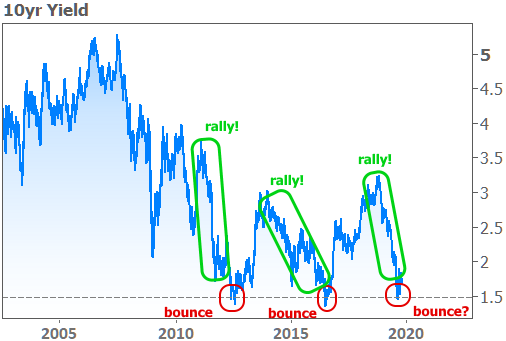
If we look at the super long term chart of 10yr yields (a proxy for momentum in longer-term rates like 30yr fixed mortgages), we see a refreshing trend is not only intact, but that rates may be on the move to the most exciting side of the ‘railroad tracks.’
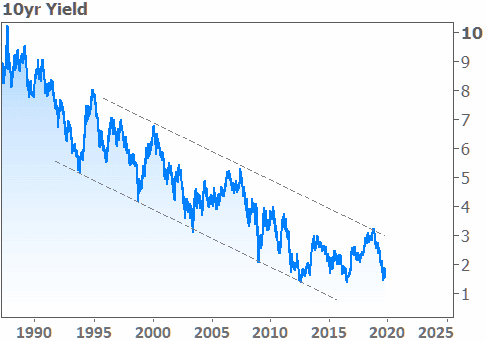
Lest we get too excited about such things, it will serve us well to keep last week’s cautionary message in mind. We do indeed need to remain vigilant about the risk of a rising rate trend taking root. We certainly managed to avoid confirming such things this week, but if we apply a few other lines to the chart above and zoom in on the last 10 years, we find cause for concern in 2019 being potentially one of only a few big turning points where rates surged to long-term lows and then began a relatively unpleasant move higher.