One great (frustrating) thing about financial market discourse is the fact that so many words have more than one meaning. “Test”is a good example. Among analysts, “test” can refer to an attempt to break through a certain barrier in any given market. With that in mind, this week saw several important tests, and next week promises at least one more.
This week’s test focuses on a sort of “magic line” for rates–a distinction it earned by acting as a firm floor in March. With rates finally gaining some ground after a horrible start to 2018, this magic line was a reminder of the lingering headwinds that made things horrible in the first place (Fed tightening, increased Treasury issuance to pay for fiscal policies, and upside risks to economic growth and inflation from those fiscal policies).
Staring down the magic line back in late March, we knew we’d need help from something big and economically threatening (bad economic news tends to help rates). Enter the trade war. Trade tensions were already on the radar but the late March tariff announcement (the one that focused on China) caused enough of a stir to help rates break below the magic line.
Before we look at the magic line on a chart, let’s give credit where it’s due. Much of the bond market demand in late March and in general over the past few weeks has come courtesy of panicked stock market selling. As money flees stocks, some of it seeks safer havens in the bond market. Excess demand for bonds pushes rates lower, all other things being equal.
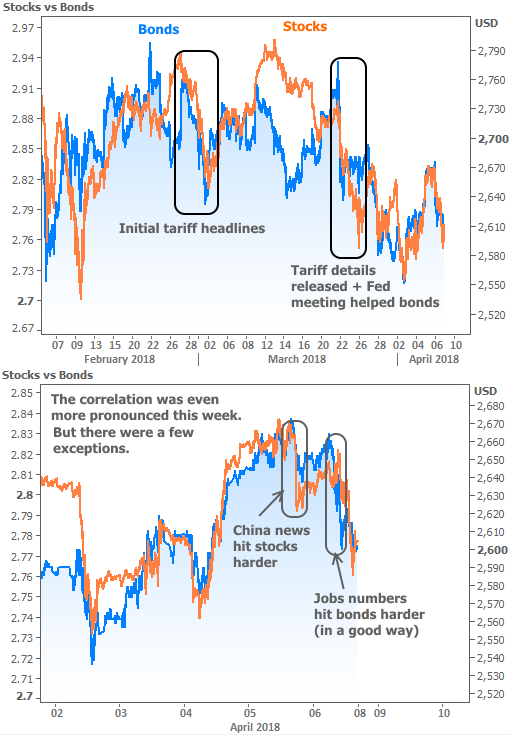
As the chart suggests, stocks and bonds have been well correlated, but each retains some of its own motivations. In late March, the Fed Announcement (and press conference) did more to help bonds than to hurt stocks. This week, China’s retaliatory tariff threats caused a sharper drop in stock prices than bond yields. Finally, Friday’s jobs numbers also helped bonds/rates more than they hurt stocks. And that’s where we see the magic happen:
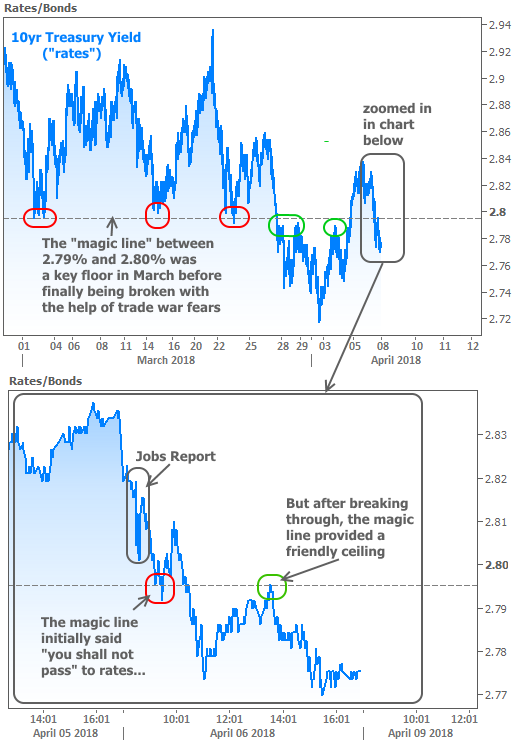
Another successful “test” of the magic line! The green circle is something analysts like to see when looking at charts. Any time rates break through an important line in the sand, it adds validity to the breakout if rates return to the broken line and bounce on the other side.
The hope is that the once strong floor will be a strong ceiling. Unfortunately, the direction of rates won’t be dictated solely by the tea-leaf signals in the charts. There’s an actual test coming up for rates next week. It has to do with April’s most important inflation report: The Consumer Price Index (CPI).
While there are many measures of inflation, CPI currently has the biggest impact on rates. Inflation is a key component of interest rates, but its importance was utterly crushed by the post-crisis economic environment. But it won’t stay crushed forever. Even with downbeat reports like this week’s jobs numbers, the labor market continues to be in one of its best expansions ever. This leads traders to wonder when the good economic data will finally translate to a more meaningful uptick in inflation.
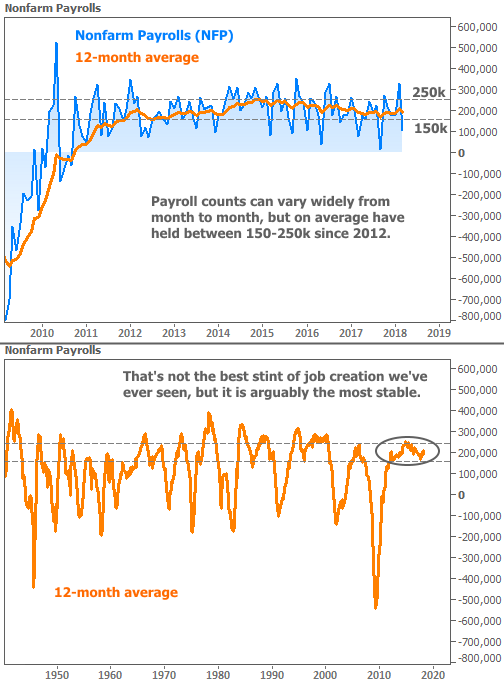
It looked like that uptick had finally arrived in 2016, but by the middle of 2017, we’d seen a surprise downturn in CPI (red circle below). This helped put rising rates on hold, but it also meant that investors were that much more vigilant about the next move higher. To understand why inflation is such a big concern for rates, consider the following chart. Note the orange line (rates) holding higher relative to the blue line (inflation) until 2011 (the era of central bank bond buying, which artificially depresses rates).
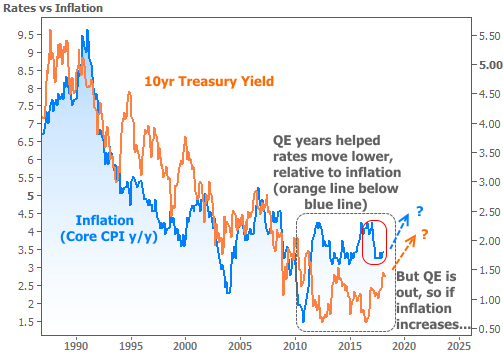
Now that central banks are removing accommodation, the orange line should gravitate back toward the blue line. In other words, rates should go higher, relative to inflation. With that in mind, if next week’s CPI numbers make it look like the blue line is embarking on another journey higher, it would have seriously negative connotations for rates. Of course inflation could come in lower than expected and end up helping rates too!
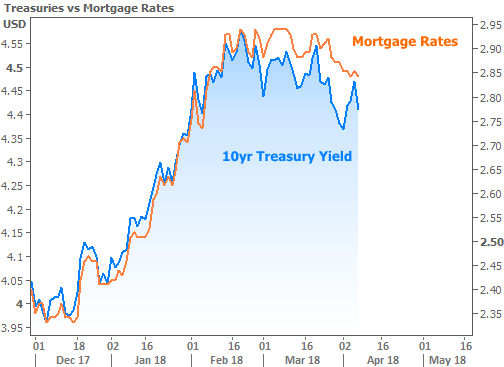
Either way, it has at least as much market moving potential for rates as anything else (like trade war headlines). The biggest risk to rates is that something happens to sooth trade war fears AND the CPI data comes in stronger than expected. Fortunately, big moves in rates have been measured in fractions of percentage points for the past few months, and mortgage rates have been much slower to react than Treasuries.