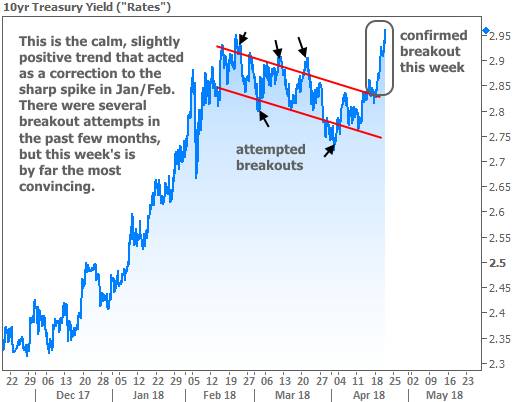
2018 began with a massive spike in interest rates. It was the proverbial big bad wolf for housing markets and for financial markets in general, or so we’re told. Refreshingly, the wolf was on vacation in March–rates moderated in a narrow, friendlier range–but now he’s back, huffing and puffing.

This old wolf not only gets a bad rap, but he also gets more credit than he deserves. Rate spikes like this are simultaneously feared as a negative indicator for housing and blamed for spooking the stock market. A housing hit seems logical enough. After all, rates affect affordability. But in reality, none of the ups and downs in rates over the past few years have had commensurate impacts on housing numbers.
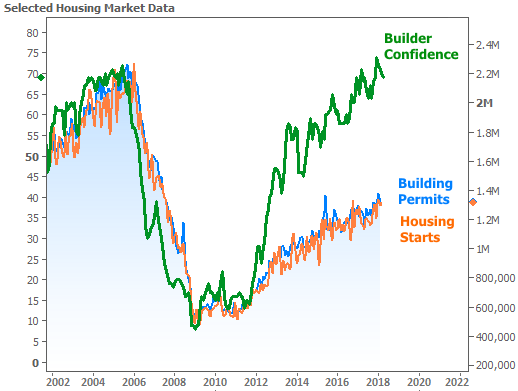
The following chart shows this week’s housing-related data, which consisted of Builder Confidence and the New Residential Construction report (Building Permits and Housing Starts). Granted, these reports cover the month of March, but the lines on the chart also traveled through the big rate spike at the beginning of 2018–not to mention the even bigger example in 2013–without missing a beat. Conclusion: if something is going to derail these trends, it’s not rate spikes.

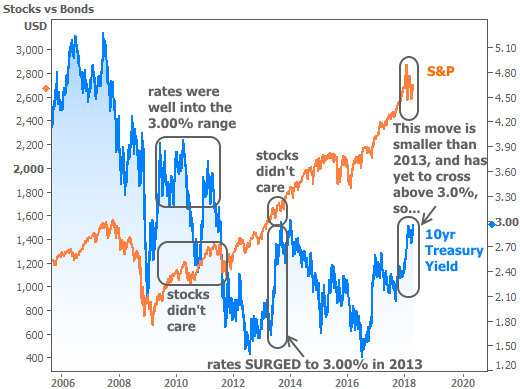
How about the stock market? It was fairly tough to tune-in to financial news this week without seeing the rate spike being blamed for slumping stocks. Rather than bore you with words, I’ll just leave the following chart right here (conclusion: stocks didn’t care about 3% 10yr Treasury yields in the past, nor did they care about a much bigger rate spike in 2013):

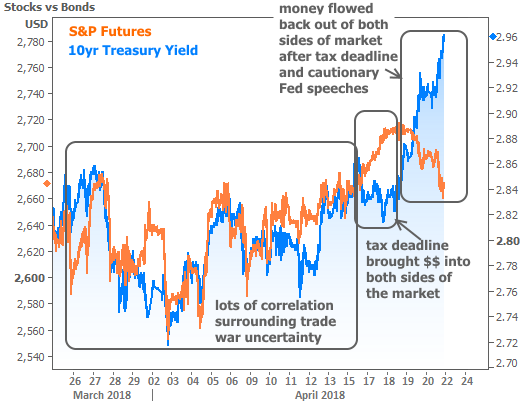
So if it’s not the rate spike, what’s up with investors selling stocks and bonds at the same time? Before addressing that, it’s worth remembering that, although stocks fell at the end of the week, they managed to hit the best weekly closing levels since before Trump’s tariff announcement in March. But one could still argue that Friday’s sharper stock losses were the result of the rate spike.
In light of the strong correlation seen in recent weeks, this was indeed an odd dynamic, but it could be largely explained by tax season. Consider the extra cash streaming into the hands of fund managers as a result of the tax deadline for retirement account funding. In the following chart, it looks like this may have given stocks a boost and delayed the rate spike (more buyers = blue line can stay lower). Stocks then moved lower after the tax deadline passed.

In addition to potential market complications from tax season, we also heard from several Fed officials this week. The general tone was that the Fed Funds Rate was well on its way to 3% (or close to it) and that monetary policy would be increasingly restrictive in the coming years. One Fed Governor (Brainard) even mentioned asset price imbalances and leverage in the context of “cyclical pressures.”
In other words, she was saying what many pundits have been debating: this economic expansion is getting old. And while we’re often reminded that expansions don’t die of old age, it’s another matter if warning signs (like leverage and asset price imbalances) begin to increase. Brainard’s comment happens to be in line with research from several economists who’ve recently noted a growing collection of “warning signs.”
There’s always a massive amount of uncertainty about what the next shift in any economic cycle might look like when we’re still in the economic cycle in question! But if stocks were to lose enough ground–and especially if a new political regime were to reverse some of the government borrowing trends associated with the tax bill–the bond market would likely have enough support for rates to turn a corner and head lower in a meaningful way.


