It’s been all over the news in October, and before then in February: rising rates are causing heavy stock losses! The bigger the stock losses, the more rates get blamed. To some extent, and for some investors, that may be true, but it sure wasn’t true this week.
This week was all about stocks, and if they were going to take any solace from lower rates, they had ample opportunity. Sell-offs of this size are almost always multifaceted issues. So while we can’t say that investors weren’t thinking about rates, we cancertainly say that the average investor was thinking a lot more about other things.
Ranking those “other things” isn’t too important for our purposes today (most would put corporate earnings at the top of the list, if you’re curious). What’s important is that stocks had a big impact on interest rates.
It actually makes a lot more sense for a big stock sell-off to have a direct effect on interest rates. As money flees the stock market, it needs a home–a safe haven in which to weather the storm. The bond market typically soaks up at least some of that safe-haven demand, and higher demand for bonds means lower rates.
The extent to which investors choose the bond market as that safe haven varies greatly. The following charts will examine this phenomenon. First, let’s take a look at just how highly correlated stocks and bonds were this week.
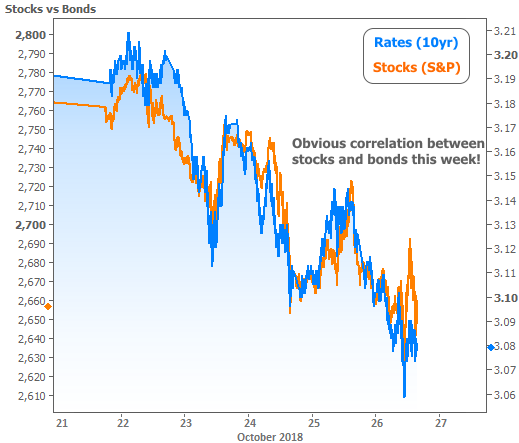
Even when stocks and bonds aren’t moving in relatively perfect unison like this, it’s still fairly common to see general correlation. The entire month of September was a fairly good example.
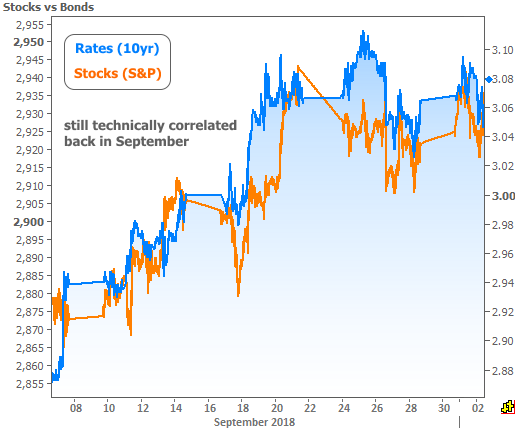
But the September chart raises an important question: what is correlation when it comes to stocks and bonds? If the two lines are moving in the same direction over a certain amount of time, they’re technically “correlated” during that time. But this says nothing of magnitudes.
To illustrate this point, consider that the y-axis is very different for the two charts above. This past week has seen nearly doublethe movement in stocks, but roughly the same in bonds. That alone tells us the magnitude of the correlation is different, but let’s visualize it! To do that, we can “lock in” the correlation seen back in September and then zoom out to see everything that’s happened since then.
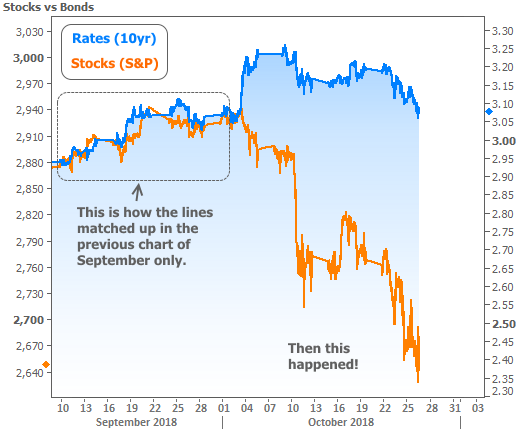
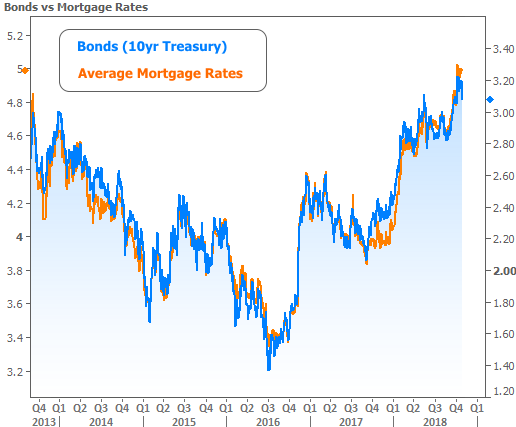
If you look closely, you can see the correlation is still there (i.e. rates are moving lower when stocks are tanking), but the magnitude of the correlated moves varies immensely. The implication is that it will take heavy stock losses on an ongoing basis if we’re to see even a moderate drop in interest rates from here.
One extra layer of complexity comes from the relationship between the rates implied by Treasury yields (seen in the chart above), and those that actually make their way onto mortgage lenders’ rate sheets. Don’t worry, the correlation here is infinitely more well-behaved over time. Case in point:
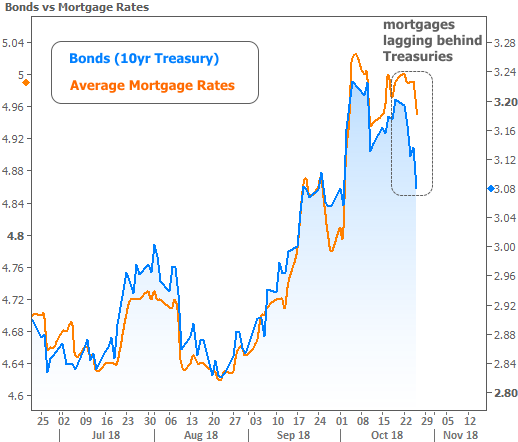
That said, it can definitely take mortgage rates some time to get caught up with more abrupt movement in the broader bond market. Although mortgage rates did fall nicely on Friday, they didn’t move nearly as much as 10yr Treasury yields over the course of the week. The implication is that if next week begins with stability in bond market, mortgage rates could continue to close this gap in a favorable way.
In housing specific news this week, there were two key reports. The first–New Home Sales–was a bit gloomy. It moved below its supportive trend of growth for the first time in several years.
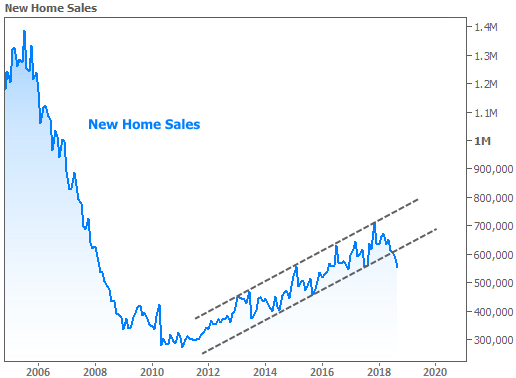
Mitigating the gloom is the fact that this is a historically volatile set of data that’s often revised. Beyond that, if housing numbers are leveling-off, we should expect uptrends like the one seen in the chart above to be broken in favor of more sideways momentum.
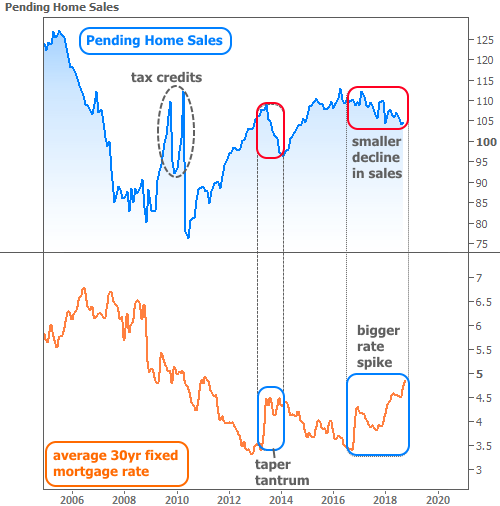
The other housing report was not only more timely (it deals with new purchase contracts as opposed to finalized sales), but also more upbeat. The National Association of Realtors Pending Home Sales Index increased for September, thus suggesting stronger Existing Home Sales in October.
In addition to the modest gains, there’s a hidden message about the housing market’s resilience in the chart. Simply put, mortgage rates have now risen much more overall, and to much higher levels than they did in 2013’s taper tantrum, yet the corresponding drop in Pending Home Sales is significantly smaller. Bottom line: this doesn’t look like a housing market that is interested in panicking.