Once a month, the government releases the Employment Situation, also known as “the jobs report.” No other piece of economic data is as consistently relevant for the bond market and, thus, interest rates.
For most of the past year, the normal correlation between jobs and rates was on hold. That makes sense, of course. Initial lockdowns completely obliterated the labor market and we’ve been waiting to see how it would recover and how it would be reshaped ever since.
In the past 1-2 months, the bond market has finally shown some willingness to react to economic reports. Notably, last month’s exceptionally strong jobs numbers put obvious upward pressure on rates. Because of that, anticipation was high for this week’s report.
Indeed, there was a very big reaction. Economists were expecting the economy to create nearly 1 million jobs, but the actual number only ended up being 266k! That makes this one of the biggest misses in the history of this report.
Bond yields did the logical thing and moved immediately lower, but paradoxically retreated nearly as fast. On the way back up from their lowest levels in months, 10yr yields tried to recover, but were met with resistance at 1.53%–the same floor that rejected rally attempts on several occasions in mid April.
The play by play in the last paragraph is confusing, so how about a chart?! The blue line shows intraday movement of 10yr yields. The big vertical drop coincides precisely with 8:30am ET when the report was released.

Zooming out a bit, we can see the context for 1.53 (NOTE: the line in the following chart doesn’t dip below 1.53 because it is an HOURLY chart and yields were back above 1.53 by 9am ET).

In considering the chart above, one positive counterpoint would be the fact that most the week was spent with yields moving lower. The news is even better for mortgage rates which have been able to do even better than their Treasury benchmarks (10yr yields and mortgage rates normally move in relative lock-step).
This has been happening for more than a month as mortgage rates pushed down to their lowest levels since late February.

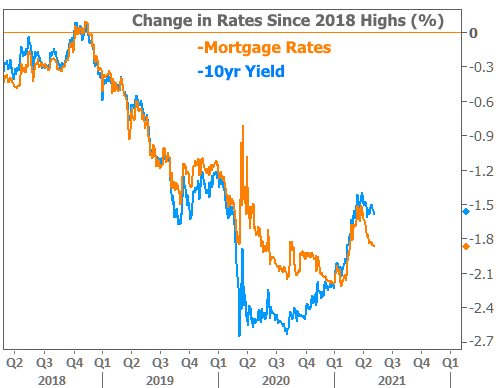
While this might look like a big departure for mortgage rates, the following chart offers more context. The only important takeaway, however, is that correlation has largely been restored after a complete breakdown in 2020, and mortgage rates will have a tough time diverging too much more from Treasuries.

As for the most recent bout of divergence, there are a few esoteric reasons for it. These include things like unprecedented outperformance on the part of mortgage-backed-bonds, the changing shape of the yield curve, and the gradual tightening of mortgage lender margins.
On a simpler note, we can also consider that Treasuries face a few more challenges than mortgage bonds these days. Friday offered a great example of that as administration officials were quick to lean on the jobs data as evidence that the economy still needs support.
Why would that matter for Treasuries? In general, the more fiscal support the economy needs, the more Treasuries will need to be issued. Higher Treasury issuance means more Treasury supply which, in turn, results in higher yields–all other things being equal.
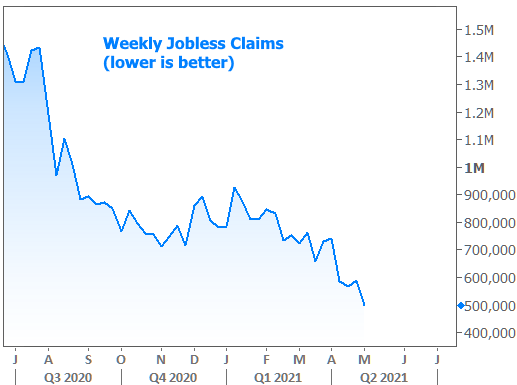
That’s not to say markets saw it that way. In fact, many market participants simply disregarded jobs number as an outlier in an economic recovery that will continue to produce noisy data. Indeed, this week’s other high profile data painted a brighter picture. On the labor market front, weekly Jobless Claims hit a post-pandemic low.

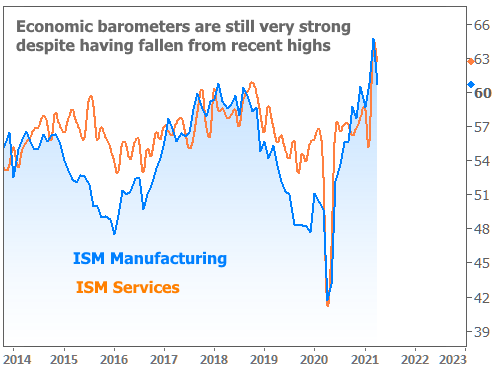
In terms of broader economic indicators, the Institute for Supply Management (ISM) released its indices that track the manufacturing and services sectors. While both declined slightly from last month, they landed on levels that are still exceptionally strong.

Next week’s primary focus for rates will be on a fresh round of Treasury auctions. Dollar amounts will be the highest ever. These auctions act as an important gauge of investor appetite for bonds. Lackluster demand would mean rates need to rise in order to attract more buyers.


