As of Thursday, most major news outlets and even several important trade organizations ran headlines claiming mortgage rates were flat this week. But rates are actually much lower compared to last week. What’s up with that?
The culprit is the weekly mortgage rate survey compiled by Freddie Mac which has been the mortgage world’s go-to rate index for decades. There’s nothing wrong with Freddie’s data or the quotes it receives from loan originators. It’s just stale.
The Freddie survey technically accepts responses from lenders on Monday through Wednesday, but in practice, Monday and Tuesday get almost all the weight. That can cause obvious problems when rates make big moves from Wednesday through Friday, which is exactly what happened this week.
The problem was compounded by the fact that Monday and Tuesday of last week saw the lowest rates. With that in mind, it is true that the rates from the beginning of this week weren’t very different from those at the beginning of last week.
But when we look at more timely rate data, we see the average lender is offering rates that are 0.125% lower today versus the end of last week. We also see that, at the time of the alarming rate headlines 2 weeks ago, actual rates had already turned the corner.

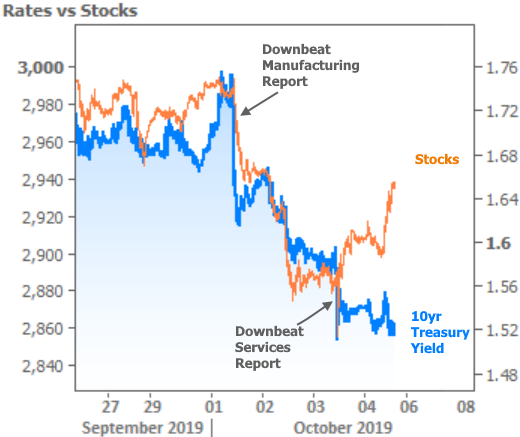
All of the above brings rates back within striking distance of multi-year lows and marks the 3rd straight week moving solidly lower. Most of this week’s improvement came courtesy of two key economic reports that showed much larger than expected declines in the manufacturing and services sectors. Weak economic data generally helps rates move lower, all other things being equal. It also tends to hurt stocks, as can be seen in the chart of this week’s market movement.

The connection with the economic reports is clear. When investors sell stocks and seek safe-havens, the bond market is one of the first places they look. Higher demand for bonds equates to lower rates, all other things being equal. But why did stocks move up at the end of the week even as bonds continued to hug the lows?
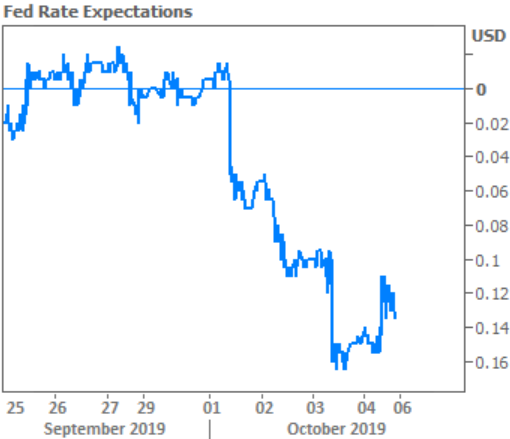
When the economic data is weak enough and when we know the Fed is actively considering its options for rate cuts in the coming months based on that data, the market sees higher odds of deeper rate cuts. And stocks love Fed rate cuts. The following chart of Fed rate cut expectations shows the market priced in roughly one half of an additional rate cut just this week! Notably, the sharp decline on October 3rd lines up with the stock market bounce.

Fed rate expectations moved a bit higher on Friday after the big jobs report showed the lowest unemployment rate in 50 years and slightly stronger than expected job creation. (Fun fact: the job creation tally is based on businesses reporting their employee counts while the unemployment rate is based on a survey of households.)
The dichotomy of ultra weak and ultra strong data highlights the market’s current quandary. Investors are actively considering the possibility of economic contraction versus a second wind for the longstanding expansion. Proponents of the latter argue that trade-related uncertainty has only taken a temporary toll on the data and, once it is resolved, the weaker parts of the economy can bounce back to stronger levels.
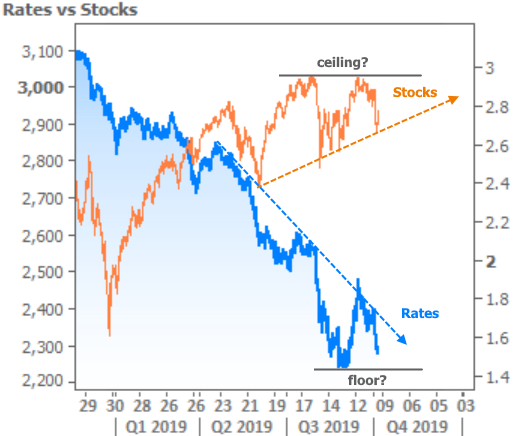
This indecision is apparent when we zoom the stock/bond chart out to a slightly wider view. Both sides of the market are just off their best levels in a long time. Bonds would benefit more if economic weakness continues. Stocks are positioning for a friendly Fed and the fact that hope remains alive for the economic expansion to continue. As such, economic data will remain closely watched in the coming weeks.


