If you’ve been anywhere close to the housing market over the past few years, you know mortgage rates have been rising. Last week brought one of the sharpest increases in years even as rates were already pushing long-term highs. Now, this week’s massive stock sell-off dropped in to remind us that rates don’t always rise in a straight line.
There’s a common misconception that stocks and rates move in the same direction. Stronger economy, higher stock prices, more jobs, more inflation, higher rates! Right?! In reality, it’s not quite that simple, and it’s always helpful to revisit the following chart to see why.
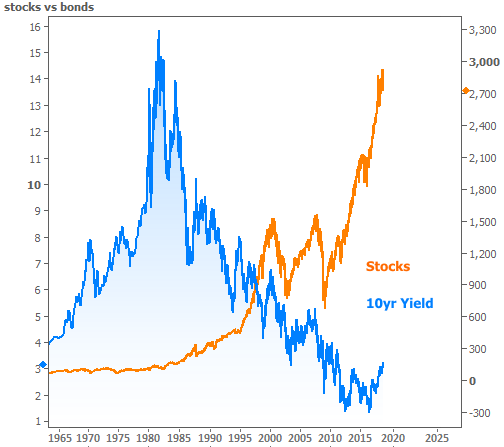
Despite the chart above, stocks and rates actually DO spend quite a bit of time moving in the same direction. In fact, the only real misconception is that they’re ALWAYS moving in the same direction. Sometimes, they’re joined at the hip. Other times, they’re clearly moving in opposite directions.
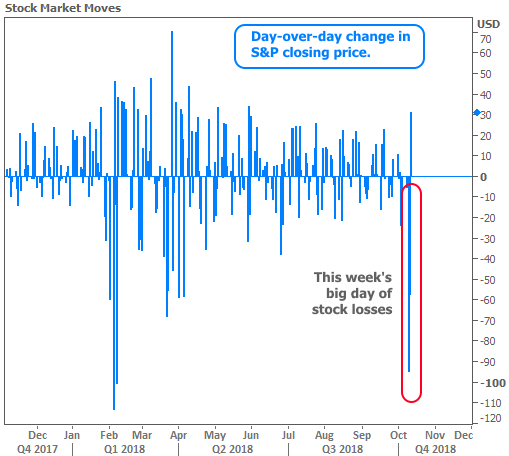
Fortunately for rates, the biggest stock market sell-offs are almost always helpful. And this week’s was big! In fact, Wednesday’s stock sell-off was the 3rd biggest since the Financial Crisis (the other two were in early 2018).
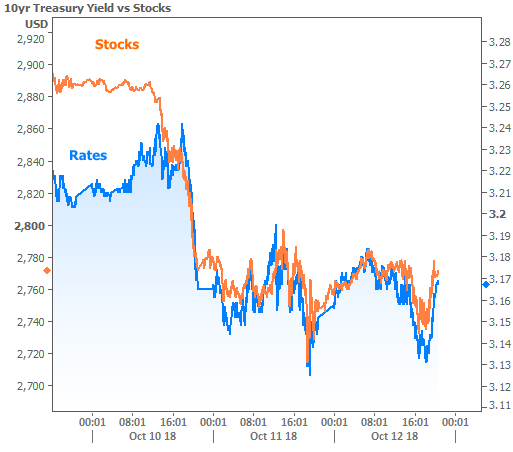
Rates were reluctant to follow stocks lower at first, but once things started to get really ugly for stocks, that changed. Rates were then relatively preoccupied with the prospect of additional weakness (which would have helped even more) or the risk of a big bounce (which would likely have caused rates to bounce as well).
The net effect was that mortgage rates fell back to their lowest levels since last Thursday by the end of the week. You may have seen news stories over the past two days talking about a “sharp move higher” in rates. This has to do with stale underlying data used by many media outlets to write their once-a-week mortgage rate article. The sharp move higher occurred LAST week, as we discussed at the time.
With that in mind, it’s important to remember that we’re still in a rising rate environment. There are big headwinds in place and they won’t go away quickly or easily. Rates’ reluctance to follow big stock losses is apparent in the following chart.
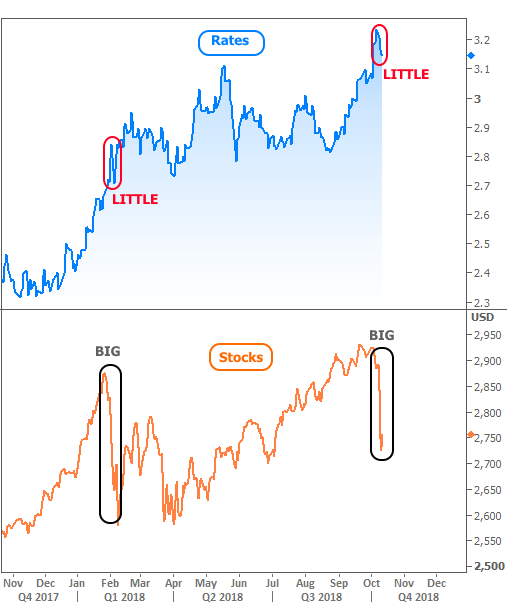
The silver lining is that financial markets are well aware of the challenges facing rates. And when traders are well aware of something, they trade accordingly. That means they’ve already pushed rates part of the way toward their expected destination, thus leaving more room for pockets of recoveryalong the way.
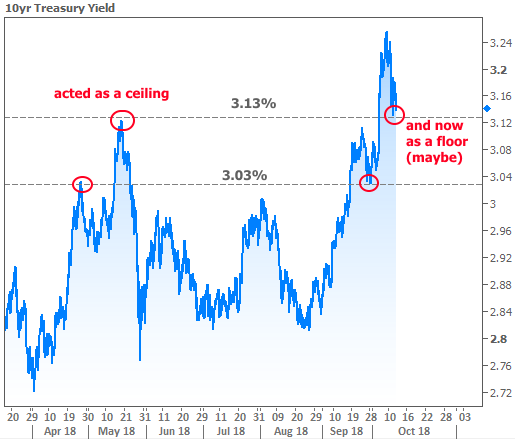
Much of the time, these pockets of recovery will take rates back down a ceiling they’d recently broken. In terms of 10yr Treasury yields (which tend to move proportionately with mortgage rates), 3.13% looks like just such a ceiling. A break below 3.13% would then suggest a move back toward 3.03%. And while none of that would look very impressive in the bigger picture, it could make a big difference for prospective buyers and borrowers in the coming weeks.
