Brace yourself. There’s a lot to unpack this week. When it comes to factors affecting home sales, rates, and markets in general, we’ve rarely seen such a combination of complexity, uncertainty, and unpredictability.
Home Sales Shocker
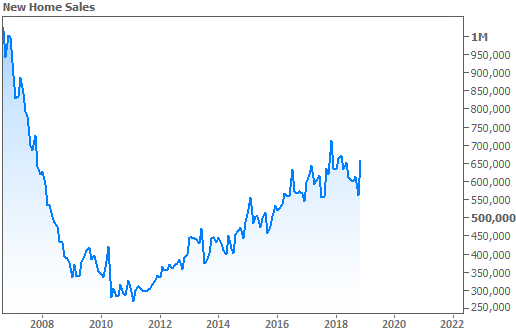
After being delayed for several weeks due to the shutdown, we finally got New Home Sales numbers for November. This isn’t the most highly regarded sales report out there because it’s government data that only counts new construction. But given the state of flux in housing, we’ll take what we can get these days.
Apparently, buyers of new homes took what they could get in November too, because sales surged nearly 17%! Could this be temporary? Could it be a product of the government’s huge margin of error when it comes to this report? Could it simply be a bounce back after months of weakness? Sure, but all we know for now is that this chart looks better than it did!
In the same report, median prices of new homes had a completely different experience. They fell sharply.
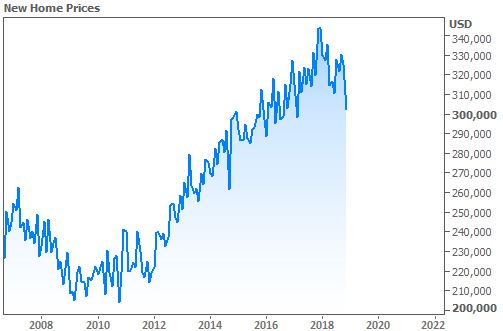
Is this evidence of a major shift in home price momentum or the housing market in general? Thankfully, probably not. As we discussed last week, home price gains have decelerated, but they haven’t declined in the manner suggested above. The chart represents several key limitations of tracking prices on all new homes sold.
First, if homes get smaller or if more homes are sold in more affordable areas, this line will fall. The same homes could be selling for more than comparable homes sold for a year ago, but if last year’s new homes were bigger, nicer, or in pricier neighborhoods, the median price would still technically be lower.
In other words, this is just a chart of prices of the homes that are actually selling. There’s no effort to account for any of the variables that true home price indices typically account for. For instance, other reports rely on “repeat sales” meaning they are comparing the sales price of a home to the last time it sold. This doesn’t mean we can’t learn something from the data, but it has more to do with housing demographics than price trends.
The Fed Shocker
File this one under “unpredictability.” The Fed sets policies that can have a profound impact on interest rates even though they don’t directly control mortgage rates. Last time around, the Fed acknowledged the need to stop hiking rates quite so fast–a shift that was well within the spectrum of what investors were expecting.
This time around, they utterly defied expectations. If they were gingerly tapping the brakes of policy normalization (aka hiking rates and shrinking balance sheet) in December, they were standing on the brake pedal with both feet this week. Highlights include:
- Complete removal of the phrase that referenced the need for “further gradual rate hikes”
- Now they say they’ll be “patient” before making “adjustments” to rates.
- Complete removal of the phrase saying risks to the economic outlook were “roughly balanced”
- Powell carefully hinted that the Fed might get back to reinvesting a bit of its bond market proceeds (good for rates).
The word “adjustment” is a huge change as it suggests a potential rate CUT instead of a HIKE. Ditching the “balanced” assessment of the economic outlook means the outlook is now negative. Even if it doesn’t pan out, the mere hint about changing the reinvestment policy is a potential game-changer for rates.
All told, this marked a sea-change in the Fed’s fairly confident and aggressive normalization approach (again, normalization = hiking rates and generally being more “strict”) . Before this, some investors wondered if the Fed had blinders on to burgeoning risks and uncertainties, but that question has definitively been answered. Markets rallied accordingly on Wednesday and Thursday (stocks up, rates down).
The Jobs Report Shocker
This is just as much a story about the government shutdown, which created a ton of uncertainty, unpredictability, and complexity surrounding this particular jobs report. Back on January 4th, the jobs data covered a period of time from BEFORE the shutdown. It also happened to be an exceptionally strong report.
Fast forward to this week where the jobs report survey was conducted during the heart of the shutdown. The Labor Department had already advised investors that furloughed workers would be counted as normal, but that the same couldn’tbe said for some contractors and other workers whose jobs depended on the government being fully open.
As such, it was completely logical to expect a big drop in the job count. The median view saw last month’s 312k report falling to 165k. Imagine everyone’s surprise when the magic number turned out to be 304k! While this report is well-known for falling far from forecasts, 139k jobs is farther than anything else we’ve seen in a long time.
One of the tricky things about the jobs report was that last month’s number was revised significantly lower. It had been even higher than this week’s number (312k) before being revised down to 222k. The combination of the huge revision and the huge surprise in the current report simply speaks to the uncertainty facing investors when it comes to assessing the health of the labor market. At the very least, however, things remain much stronger than expected (unless they’re revised next month!).
The Interest Rate Shocker
Revisions or not, markets can only trade on the info they have today. Super strong jobs reports tend to hurt interest rates. This week was no exception, especially after the rest of the week’s economic data came out stronger than expected on Friday morning (strong data = higher rates, in general). But if Friday’s rate spike could be characterized as abrupt, it’s only because rates were so low on Thursday afternoon.
In fact, the average lender was quoting mortgage rates at the lowest levels in exactly 1 year. This notion is at odds with many big name news reports due to their reliance on Freddie Mac’s weekly survey data. The survey is reliable over long time horizons, but it fails to capture day-to-day volatility, especially if that volatility occurs in the 2nd half of the week. As such, there were numerous stories about rates rising this week on the same day they hit 1-year lows. Even after the post-jobs-report rate spike, this week’s rates are still lower than last week, which is good news for the housing market.