Various speeches from members of the Federal Reserve contributed to upward pressure on rates throughout the week. But then on Friday, all that pressure was erased in an instant or two. What has that kind of power?
If you were forced to guess Friday’s big market mover in advance based on a schedule of events, the most logical choice would be the Fed’s Jackson Hole symposium. The Fed Chair often delivers a speech at Jackson Hole that’s worthy of a fairly big response.
But this year, Trump trade tweets trumped the Fed, and it wasn’t even a close call. In fact, between China announcing tariffs on the US early in the morning and Trump’s tweets a few hours later, the trade war news on Friday completely erased an entire week’s worth of movement in both stocks and bonds.
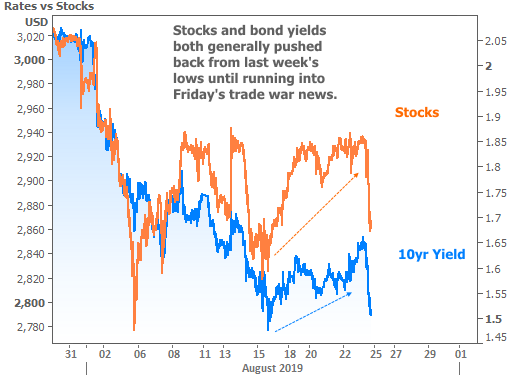
Here’s a closer look at Friday itself so we can see how Fed Chair Powell’s big speech stacked up against the trade news.
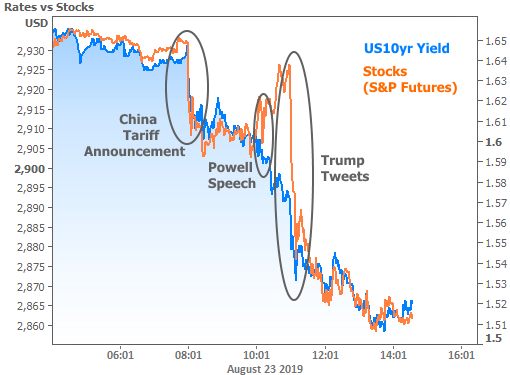
Up until then, there was some question as to rates remaining inside their super low range and stocks potentially breaking above a glass ceiling marked by recently recurring highs. Afterward, bonds look like they’re right where they want to bewhile stocks are now much closer to the other side of August’s consolidation pattern.
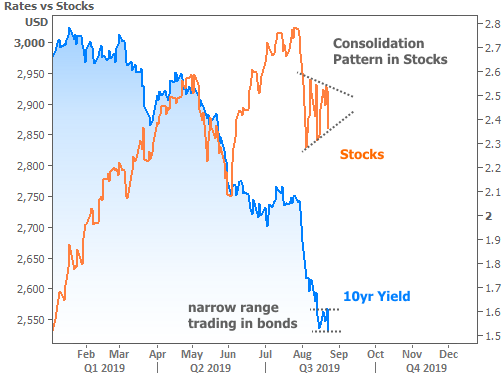
If Friday’s brand of drama continues impacting markets, both stocks and bonds could end up breaking their respective floors seen in the chart above. Market technicians believe that such breakouts carry an implication for additional momentum. Paradoxically, that might be too much of a good thing for the mortgage market.
When it comes to housing and mortgages, low rates are obviously a great thing in general. But MBS (the mortgage-backed securities that dictate the rates lenders can offer) don’t cope well with huge moves and volatility. In short, they’ve had a hard time keeping pace with the move lower in Treasury yields (which are typically almost perfectly correlated).
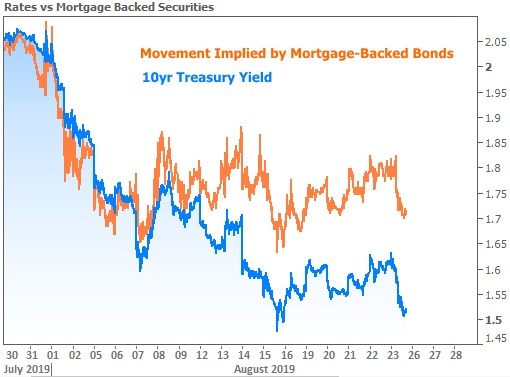
As seen in the chart above, there are several points in time where the orange line is higher than it was in the recent past while the blue line is lower. Today versus August 7th is a prime example.
So what’s the fallout? It’s actually not terrible. More than anything, this is simply something to be aware of if you need a mortgage or if your work depends upon the mortgage market in some way. Simply put: rates are super low in general, but they’re not any lower than they were earlier this month–even though the 10yr Treasury yield is trying to convince you otherwise.
Given enough stability in the bond market (which may or may not happen any time soon) and enough passage of time (which is pretty much guaranteed if you can manage to wait for it), this paradox should begin to heal itself. Just know that “time,” in this case, could be weeks or even months. If Treasury yields happen to be higher by then, mortgage rates wouldn’t likely be any lower than they are now.
Fortunately, today’s mortgage rates have been just fine as far as recent data is concerned. The “refi boom” we discussed last week continued in full swing according to this week’s data. While we’re nowhere near the epic levels seen in 2012 and early 2013, we’ve rapidly regained the still-impressive 2016 territory.
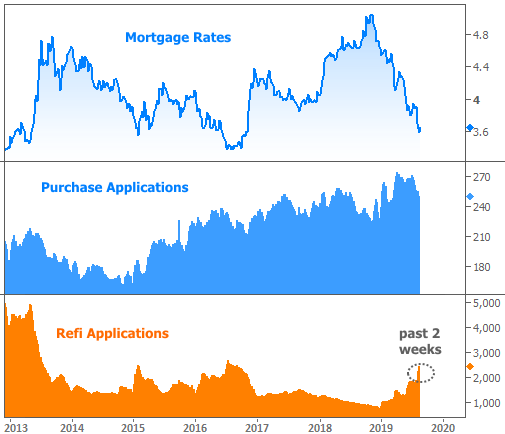
Purchase mortgage applications declined, but only due to seasonal factors (the chart above is NOT seasonally adjusted. We always see a drop at this time of year). Were we to examine year-over-year changes in purchases, we’d see some very promising trends in housing. In so doing, we could set the record straight on some unnecessarily downbeat headlines regarding New Home Sales.
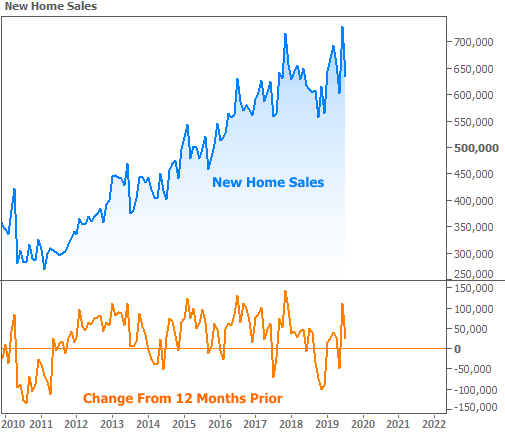
Please understand, the following is not an attempt to be a cheerleader for home sales–simply to focus on facts. At the headline level, The Census Bureau reported a 12.8% decline in July–far below the forecast calling for a 0.2% decline. But this is misleading. June’s number was initially reported as 646k (annual pace of sales). July’s tally of 635k would therefore be less than a 2% decline. What gives?
The New Home Sales data is well known for huge margins of error and substantial revisions. June contained just such a revision. It catapulted that initial 646k number to a mighty 728k! The interesting thing about 728k is that it’s the highest reading since the Financial Crisis. Moreover, it’s a REVISED number and thus more “locked-in” than July’s 635k. And if all that is too much to think about, try this: June and July combined for more New Home Sales than any other 2 months except Nov/Dec 2017. You’d have to go back to 2007 to see anything higher.
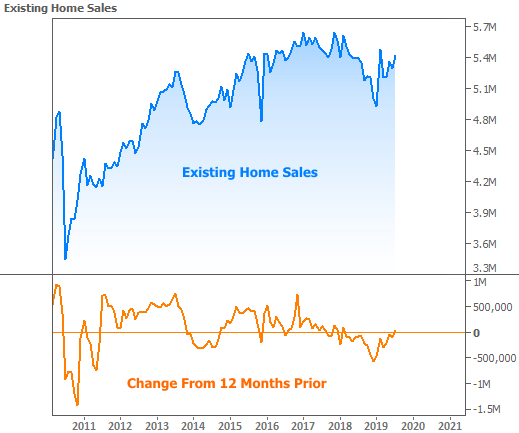
Existing Home Sales constitute a far bigger part of the housing market and the news is good there too. July’s sales brought the annual pace to 5.42 million from a positively-revised 5.29 million in June. It was the first time in more than a year that Existing Sales have been in positive territory versus the same month in the previous year.
Long-story short: the rebound in housing that this newsletter discussed extensively in early 2019 has come to fruition. Where we go from here remains to be seen and likely depends on economic variables and rates’ ability to stay in “refi boom” territory.
Rates themselves–although obviously susceptible to trade war surprises–will also take guidance from economic data. In that regard, next week is more active. Traders will be looking at manufacturing-related data to see how much the trade-related uncertainty continues to filter through to the real economy.


