It goes by many names: The Employment Situation, Nonfarm Payrolls (NFP), or simply “the jobs report.” No matter what you call it, the Labor Department’s massive collection of employment statistics is one of the most important events for the bond market every month.
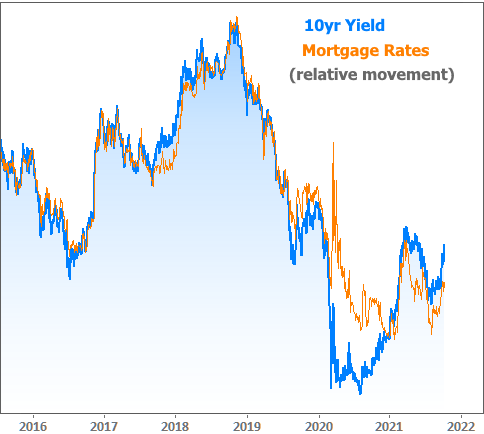
For a quick reminder as to why mortgage rates care about the bond market, here’s a chart of relative movement in the average 30yr fixed mortgage rate and 10yr Treasury Yields (the quintessential bond market benchmark).

You may notice that rates have been moving higher recently, and that’s where our journey intersects with Friday’s jobs report. In short, the government’s official job tally of 194k (new jobs created) fell extremely short of the median forecast calling for 500k.
At almost any other time in history, this would have sent rates screaming lower. This time around, however, rates responded by surging to the highest levels in months. What’s up with that?!
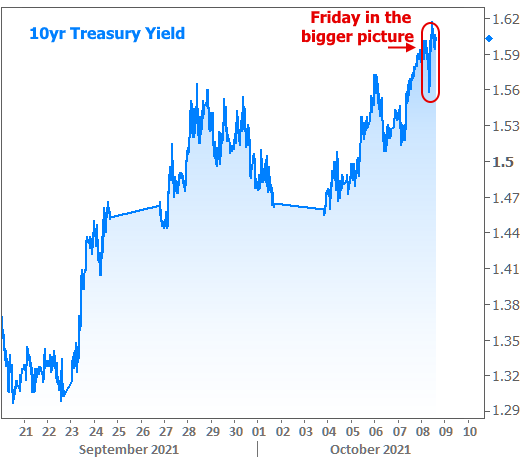
First off, context matters. A vast majority of the move to “the highest levels in months” was in the books before the jobs data hit. 10yr yields help us visualize minute-to-minute rate momentum over the past 3 weeks.

Once we come to terms with the chart above, there’s really nothing terribly important left to discuss with respect to the jobs report paradox. For those who’d like to explore more of the rabbit hole, let’s continue.
The report itself may have been much weaker than expected in terms of the “payrolls” component, but many other components of the report told a different story. The data collection is so massive that it would take a prohibitive amount of space to dissect it in detail (feel free to pore over the source material here, and don’t forget the 29 separate links to additional tables at the bottom!), so here are a few selected bullet point highlights:
- The Unemployment Rate fell to 4.8% from 5.2% previously
- Wages increased 0.2% more than expected
- Workweek hours increased 0.1 more than expected (this is actually significant by the time we consider the 161.4 million people in the labor force)
- 5 million people reported the pandemic is preventing them from working as much as they’d like (or at all). This is down from 5.6 million last month.
- 1.1 million people reported they were temporarily laid off. That number was as high as 18.0 million in April 2020. Big drop? Yes! But it was 374k lower before the pandemic.
The more time one spends sifting through all the details, the more it becomes clear that employers are ravenously hungry for employees, but employees are historically aloof. The skills gap is only one reason for this, but the pandemic is the elephant in the room (see the 4th bullet point above).
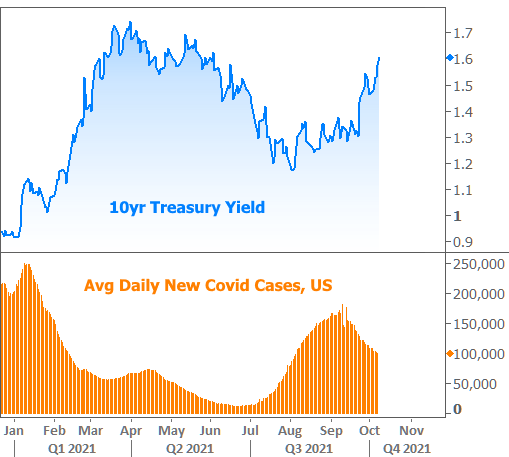
The pandemic also continues to explain why rates have jumped so willingly in the past few weeks. The marked decline in case counts lines up perfectly with the unfriendly rate breakout.

In fact, if we’d like to simply blame the pandemic for the entirety of the rate momentum landscape, all we have to do is zoom out.

And if we need to account for the mid-2021 departure from the red line, here’s how we’d do it:

All of the above adds up to the highest mortgage rates in months as of Friday afternoon–an assertion that runs counter to numerous news reports that came out on Thursday. As is often the case, Freddie Mac’s weekly mortgage rate survey is the source of the confusion. That much was already clear on Thursday when it came out (read more here). Friday’s bond losses only added to the drama.
To understand how Freddie’s survey could possibly claim rates are lower this week, consider the following chart. It shows actual movement in the mortgage bond market (the most relevant ingredient for mortgage lenders as they determine their rate offerings). The highlighted areas show when Freddie receives most of their survey responses.

Bottom line: the timing of recent market movement resulted in Freddie’s survey showing the maximum possible week-over-week drop in rates. Either way, the line speaks for itself. By Friday, it hit its highest level in more than 6 months.
Parting thoughts: for those who are surprised about this week’s surge in rates, this newsletter from early September is required reading: Rate Reckoning Draws Closer. It basically lays out everything that was at stake and even goes so far as to say an upside breakout was the more likely scenario. In other words, rates are doing exactly what we feared they would probably be doing!


