Last week marked an abrupt end to the gentle, sideways-to-slightly-lower trend in interest rates that had been intact since late February. This week, things got worse.
Whether we’re talking about 10yr Treasury yields or the average 30yr fixed mortgage, rates jumped to their highest levels in more than 4 years on Monday. The next two days were even worse.
By Wednesday afternoon, prospective borrowers were seeing rates that were at least a quarter of percentage point higher compared to the beginning of last week. This marked the first dose of true rate volatility in more than a month.
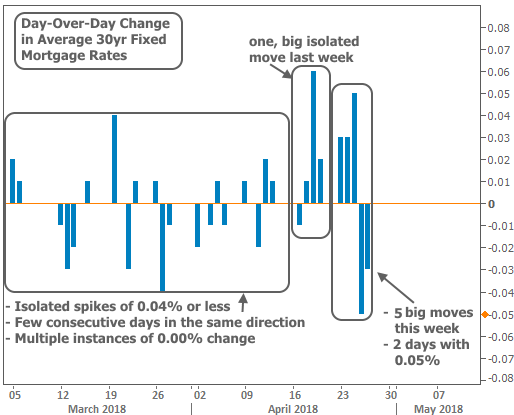
Throughout March and into the first half of April, day to day changes in rates were relatively small. Moreover, there weren’t very many days spent moving in the same direction. Several days saw NO change.
Volatility began creeping up last week with rates moving higher for 3 straight days. But even then, only one of those days saw the average 30yr fixed rate move 0.03% or more. This week, we’ve seen 0.03% every single day, at minimum. The following chart shows those day-over-day changes.
Thankfully, rates ebbed back to Monday’s levels by the end of the week, but there’s still reason to be defensive. In fact, 2018 is all about being defensive when it comes to rates due to big-picture headwinds. These headwinds have been here for months and they’re not going anywhere quickly. They include:
- A Federal Reserve (aka “The Fed”) that’s more willing to hike its policy rate while continuing to reduce the amount of bonds it buys each month. (Foreign central banks are also moving toward policy tightening).
- Fiscal policies such as the tax bill that require government borrowing, thus creating excess supply in the bond market. More supply = lower bond prices = higher rates.
- Fiscal policies such as the tax bill that may add to economic growth and inflation. Growth and inflation generally contribute to higher rates.
The most recent manifestation of this “coming to terms” process was this week’s break above 3.0% in the 10yr Treasury Yield–the yardstick against which all other long-term rates in the US are measured.
Depending on whom you ask, the break above 3% ranges anywhere from “expected” to “a surefire sign that bonds are entering a bear market and that the decades-long bull market is over.”
Let’s get a few things straight:
- It would have been shocking had we NOT seen 10yr yields above 3% this year. If you stack up the headwinds listed above and compare them to the last time rates were 3%, there’s no question that market fundamentals say rates should be higher.
- The decades-long bull market in rates can’t go on forever because it would mean rates would have to go deeper and deeper into negative territory.
- The end of that bull market isn’t as important to pinpoint as the scope of the next range. For instance, will rates then enter a BEAR market and head higher for years and years? Or will they carve out a more sideways trend?
- And finally, all it takes is a few simple lines on a chart to see that we haven’t broken out of the decades-long positive trend quite yet
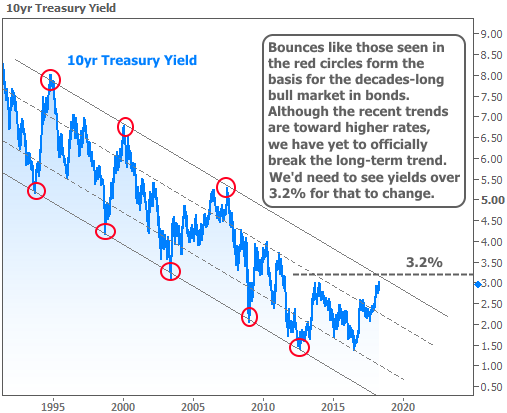
That said, it’s good to remember that the next trend could already have taken shape inside the current trend. Some analysts are pointing to the “higher lows” in rates in 2017 and (likely) 2018. They could be right, but history has sobering reminders about predicting future market movement. Specifically, there are a ton of “higher lows” in the past that ended up going nowhere.
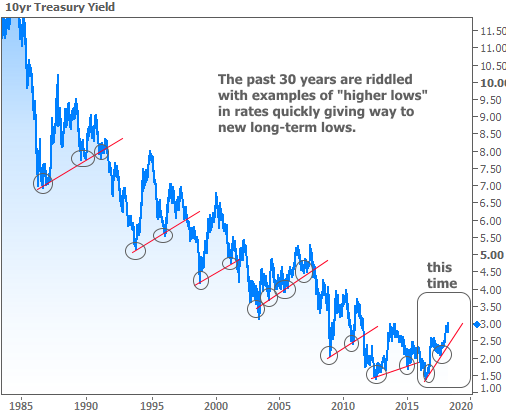
The previous chart isn’t offered as proof that rates will soon be moving lower. Rather, it’s proof that rates don’t necessarily HAVE TO go higher.
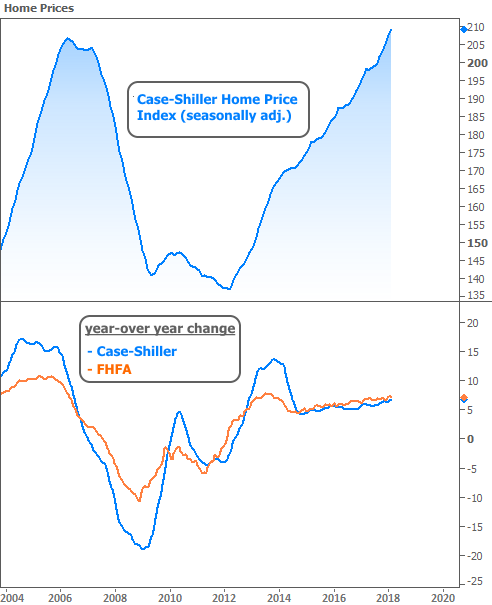
In other housing-related news this week, the two most widely-followed home price reports were released (covering the month of February). Both Case-Shiller and the FHFA showed stronger-than-expected gains, with year-over-year appreciation near 7%.
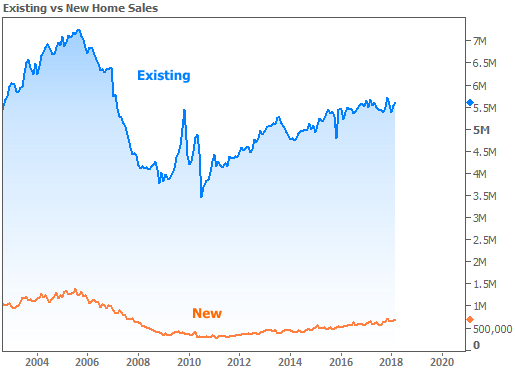
Both New and Existing Homes Sales reports were released this week (for the month of March), and both were stronger than expected. Existing Home Sales rose 1.1% versus a 0.2% median forecast, and New Home Sales added 4.0% versus a median forecast calling for a 1.9% gain.
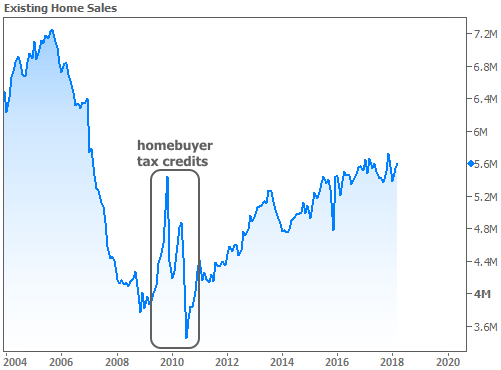
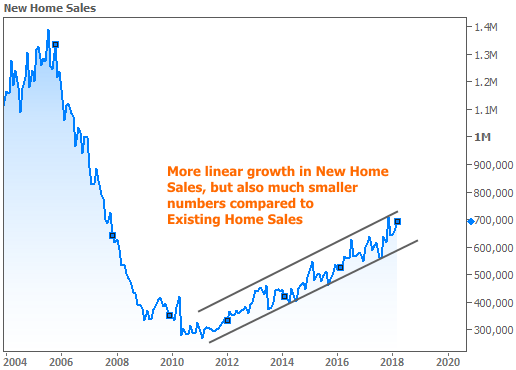
Further to the point made in the last chart, here’s what New and Existing sales look like when plotted on the same axis.
Next week brings the big jobs report (Employment Situation/Nonfarm Payrolls), which always has the potential to cause volatility for rates. Before that, we’ll get a Fed policy announcement on Wednesday. The Fed can also cause huge moves for rates, but it’s somewhat less likely next week. The Fed has 2 types of meetings: those that result in an announcement AND updated forecasts (as well as a press conference with the Fed Chair) and those that simply end with the announcement. Next week’s is the latter, and that iteration tends not to pack the same sort of punch.


