Last week ended with rates running into a floor following the Trump’s steel and aluminum tariff announcement. Financial markets viewed that as economically negative. Stocks and rates moved lower as a result. But before the week ended, both had bounced due to uncertainty about how the coming week would play out.
That bounce was important because it suggested that momentum in rates was at risk of shifting sideways after 3 weeks of modest improvements. That meant that although the big bad rate spike of early 2018 was over, we would have needed to see a better performance to suggest rates would do anything other than head sideways.
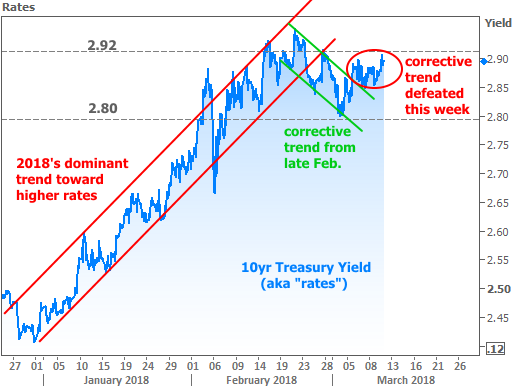
In terms of 10yr Treasury yields (the quintessential benchmark for longer term rates), the important floor was 2.80%. That’s where we bounced last week, and that’s what we failed to break back below this week. As last week’s newsletter advised, that failure implied a sideways trend which, in turn, meant rates would be exiting the corrective trend from late February (green lines below). Unfortunately for rates, that’s exactly what happened this week.

Even though we can talk about a “sideways trend” in rates and even though we can kind of see it in terms of Treasury yields, it was even more pronounced in terms of mortgage rates. Let’s talk about why that is.
Ever since the Fed began buying mortgage-backed-securities (MBS), mortgage rates have been so closely correlated with longer-term Treasury yields (the risk-free benchmark interest rates, backed by the full faith and credit of the US government) that there’s no need to look at anything but Treasuries when it comes to analyzing broader rate trends.
This week presented a curiosity though. Whereas Treasury yields did experience some volatility (albeit within a narrow range), mortgage rates, on average, were exactly the sameevery day this week. To be clear, this refers to the average of multiple lenders at the end of each business day (not every individual lender held rates steady every hour of every day!).
The following chart shows that end-of-day average mortgage rate in terms of percent change (orange line). Keep in mind that it gets incrementally more expensive for mortgage lenders to offer rate lock commitments during periods of increased volatility even though Treasuries typically have bigger initial reactions. As such, the faster rates move higher, the more fed up mortgages get, eventually overtaking the move in Treasuries as if to say “we’ll wait up here until you’re done!”

In a nutshell, that’s why mortgage rates were able to hold so steady this week. They’d already made it up to that “we’ll wait up here” level as of mid-February. They haven’t moved much since then, and this week’s moderately narrow Treasury trading range meant they didn’t need to move at all this week (again, in terms of averages).
All of the above doesn’t mean that mortgage rates will continue to be so steady. If 10yr Treasury yields were to break above 2.92% or below 2.80%, mortgages would almost certainly head in the corresponding direction.
Economic Data Highlights
This week’s key economic data was the Employment Situation, also known simply as “the jobs report” or NFP due to its headline component: nonfarm payrolls (a tally of new jobs created in the previous month). Over time, no other piece of economic data holds as much sway over markets. Recently though, strong job creation has generally been taken for granted unless it has fallen extremely far from forecast levels.
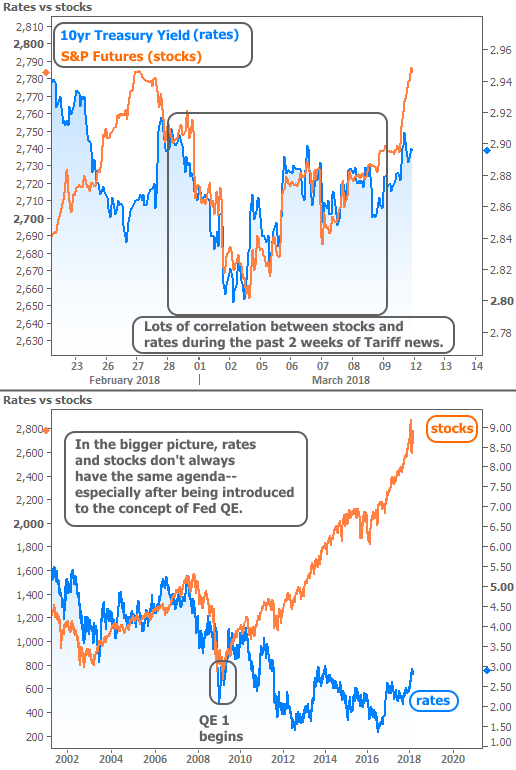
At 313k versus a median forecast of 200k, this month’s report certainly fits the bill. After moving higher and lower throughout the week on adjustments to the tariff news, stocks and bond yields lurched higher at the end of the week following the jobs data, but stocks moved much faster, relatively.

As the chart above shows, there’s no magic rule that says stocks have to follow bonds and vice versa, but the breakaway seen in stocks is still notable. In this case, it has as much to do with the time frame captured in the chart. Both stocks and bond yields moved back in line with late February’s highs and stocks happened to have more ground to cover to get there.
All that having been said, if there’s a quantifiable reason that bonds were able to resist that move, it may have to do with the average hourly earnings component of the jobs report. Not onlydid wages move unexpectedly lower, they also erased the year-over-year gains seen last month. That leaves the year-over-year wage growth stuck under a ceiling that’s been intact since early 2016.
Better wage growth is seen as a key ingredient for inflation, which is one of the two fundamental inputs for interest rate movement. In other words, rates have been moving higher, in part, due to increased inflation expectations. When wages look unwilling to make bigger gains, it helps bonds to avoid moving higher as quickly as stocks. After all, the companies underlying those stock prices can perform that much better if they’re not being forced to raise wages as quickly!


