There are refi booms and then there are refi booms! Numbers were never higher than they were during several weeks in 2009 and they were never “extremely elevated for nearly 2 years” like they were from August 2011 through May 2013. It would take some doing to get back to those levels, but relative to the past few years, refi numbers are picking up quickly.
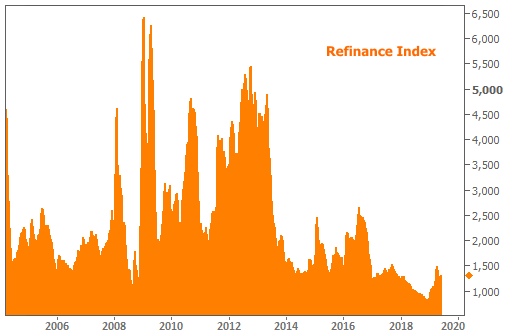
Granted, the chart above doesn’t make things look too impressive, but it’s only fair to start with that sense of scale. If we zoom in to just the past few years, the outlook is much brighter.
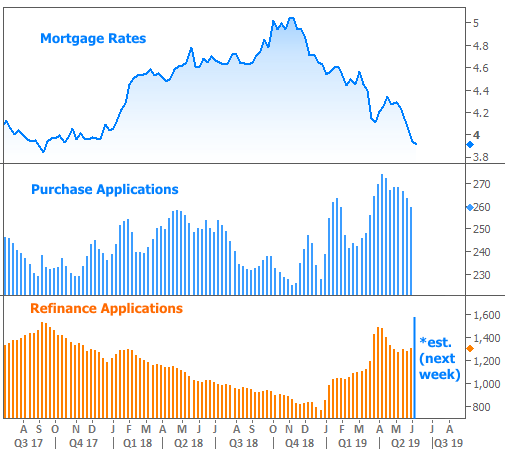
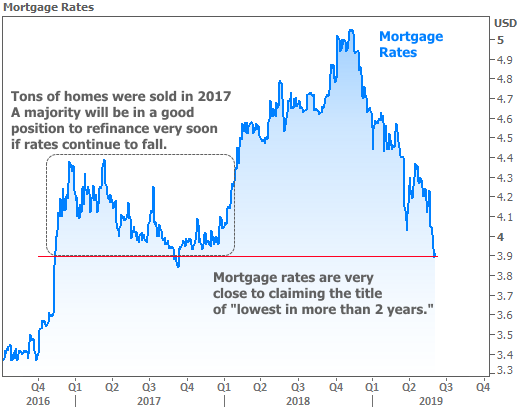
As the chart suggests, refinance demand has already increased significantly after grinding to a halt at the end of 2018. The big drop in rates in late March had an obvious impact, but this week’s drop isn’t even on the charts yet. Once it is, we’re likely to see something just as high if not higher. Reason being: the long-term peak in existing home sales coincided with rates that will soon be “in the money” with respect to refinancing. Those homeowners have been trapped without access to lower rates for 2 years now.
The prospect for additional improvements in rates is more than wishful thinking. In the past few months–and especially in this past week–we’ve seen strong momentum, not only toward lower rates, but also in the market’s expectations for a Fed rate CUT. In the following chart, the orange line represents actual trading levels in short-term interest rate swaps (which always move to price-in changes in the Fed Funds Rate based on market expectations).
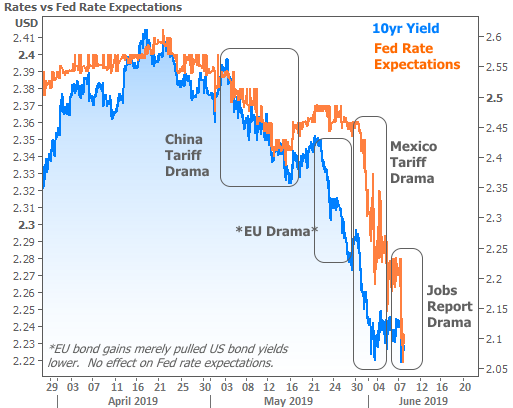
Notice how the “expectations” line was flat in April. Back then, investors weren’t expecting the Fed to move any time soon. Shortly after Trump tweeted about raising tariffs on Chinese goods, that began to change. And it was tariffs again in late May that were responsible for the next major leg down in Fed rate expectations. This week’s jobs data played a role as well, even though it’s not as easy to see on the chart.
Mortgage rates in particular moved decisively lower on Friday following a much weaker-than-expected jobs report showing the economy only created 75k new jobs in May compared to a median forecast of 185k. The previous two months were also revised moderately lower.
The labor market has been the strongest and most resilientcomponent of the current economic expansion in the US. Whereas analysts might take exception to the Fed hiking rates with inflation running well under 2%, the Fed has been able to point to record low unemployment as evidence that the economy is firing on all cylinders.
Even those pining for lower rates have been able to look past isolated drops in the job tally, which have occurred several times in the past 6 years. The problem with this particular drop is that it is the SECOND number under 100k in just a few months. That hasn’t happened since 2012, when jobs were still finding their bearings after the Great Recession.
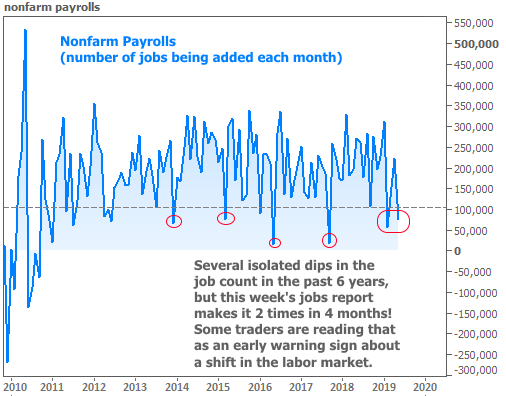
Some traders are reading this as an early warning sign about a potential shift in the labor market. That might seem a bit premature considering the volatility in the chart above, but the far less volatile ADP Employment data suggested trouble may be brewing when it released its own version of the payroll count earlier in the week. There’s far less left to the imagination here:
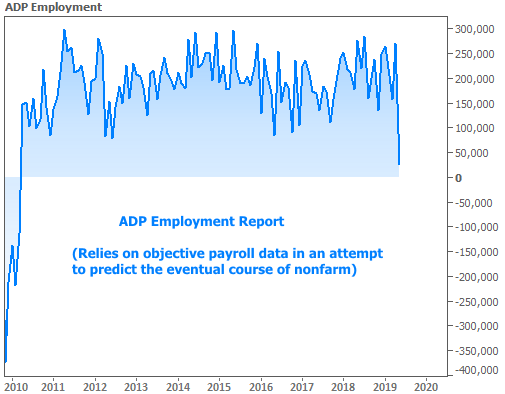
Again, the job market has been a last line of defense. As soon as it turns, that’s it. Game over. A recession (or at least a sharp contraction) will be widely expected. The bond market (i.e. “rates”) is arguably trading accordingly. From here, if economic data continues telling the same story and if progress on trade remains as elusive as it has been, the the next refi boom can be counted down in weeks and months as opposed to years


